Data Wrangle Report
1) Gather data from three different sources:
- WeRateDogs Twitter archive. This is provided by Udacity in a csv file format and contains 5000+ basic tweet data about dog rating, name, and "stage".
- Tweet image predictions. This is also provided by Udacity in tsv file format which I downloaded programmatically from Udacity site. This file contains dog breed prediction results (from a Neural Network classifier) for every dog images from the WeRateDogs Twitter archive.
- Additional Twitter Data. The data resides on Twitter site and can be pulled via their API tweepy. I used the API to query additional data (in JSON format) and downloaded into a file named tweet_json.txt. This file has favorite and retweet count information for each tweet ID in the WeRateDogs Twitter archive, which are crucial for the dog rating analysis.
2) Assess data for quality and tidiness:
- Inspected the three datasets visually and programmatically to produce a list of quality and tidiness issues.
- Quality issues include:
- various issues pertains to incorrect rating numerator and denominator values in the main twitter dataset.
- inproper data types for tweet id, timestamp, rating numerator and denominator in the main twitter dataset.
- invalid dog names and inconsistent dog naming convention in the main and secondary twitter datasets.
- presence of retweet and reply-to data in the main and secondary twitter data datasets.
- superfluous columns in the main twitter data dataset.
- Tidiness issues include:
- dog stages span four different columns in the main twitter dataset which can and should be combined into one.
- three types of observations (dog, non dog and partial) in the prediction dataset
- the three datasets can be combined into one single dataset
3) Clean data to fix quality and tidiness issues identified:
- for each of the issues identified in each dataset, prescribed a code fix, built, executed and tested the code fix.
- combined the three datasets into a single master dataset, store it to a csv file and a python database table.
4) Analyze and visualize the wrangled data:
- looked at the cleaned master dataset and produce three insights with visualizations.
Insights and visulizations produced include:
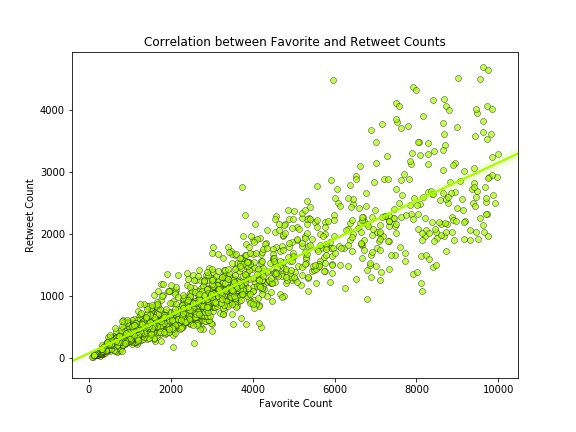
- correlation between favorite and retweet counts.
- the trend of favorite and retweet counts with respect to time and classification of dog species
- performance of the dog image classifier
Insight and Visualization Report
Overview
With the cleansed dataset created from gathering twitter data pertaining to the popular WeRateDogs dog [ref 1] rating provider on Twitter, analyzed and produced the following insights and visualizations:
1) correlation between favorite and retweet counts.
2) the trend of favorite and retweet counts with respect to time.
3) the trend of favorite and retweet counts with respect to classification of dog species.
4) performance of the dog image classifier.
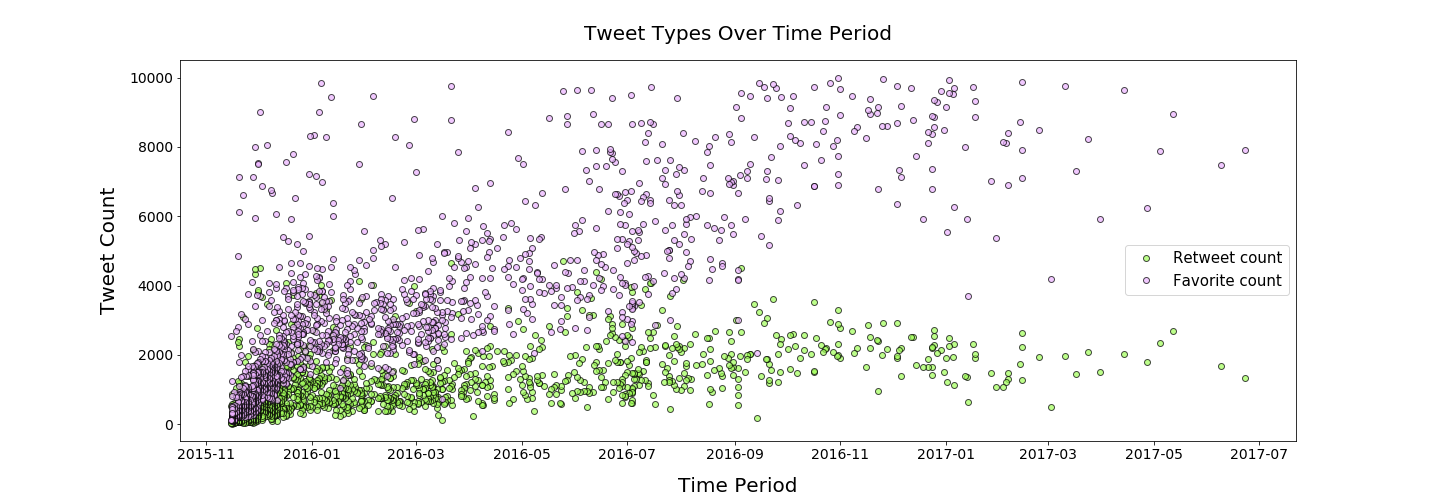
Favorite and retweet counts trends with respect to time period (Nov 2015 to Aug 2017)
From the begining till 2016-04, the intensity of both favorite and retweet counts is similar, although favorite counts are higher than retweet counts. This trend is even more conspicuous with the progression of time, with favorite counts steadily rising above retweet counts from around 2016-09. Interestingly, the bulk of retweet counts remains below 10k.
Favorite and retweet counts trends with respect to dog species by the image prediction classifier
Among the three speicies, both favorite and retweet counts have a positive correlation. The bulk of tweets is mainly from the species of dog and hybrid, which is in line with their respective species counts - 1194 dog and 472 hybrid.
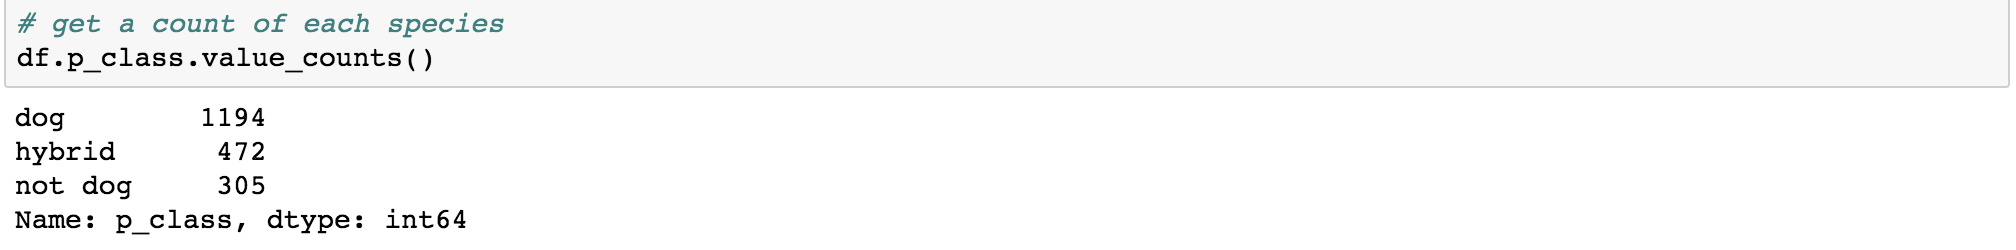
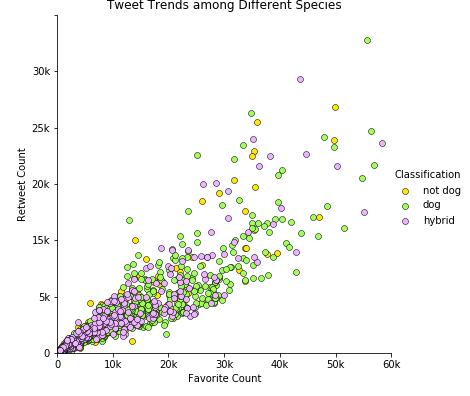
Given WeRateDogs is all about dogs, it is unconvincing there are tweets about hybrid and not dog species classified by the neural network dog breed classifier, which led us to take a look at the performance of the classifier next.
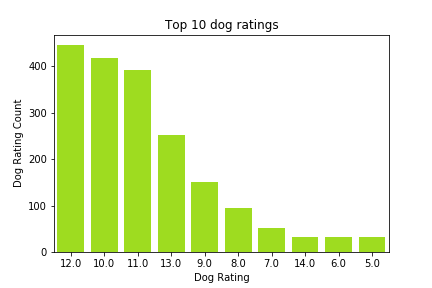
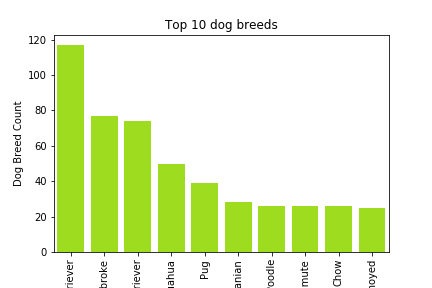
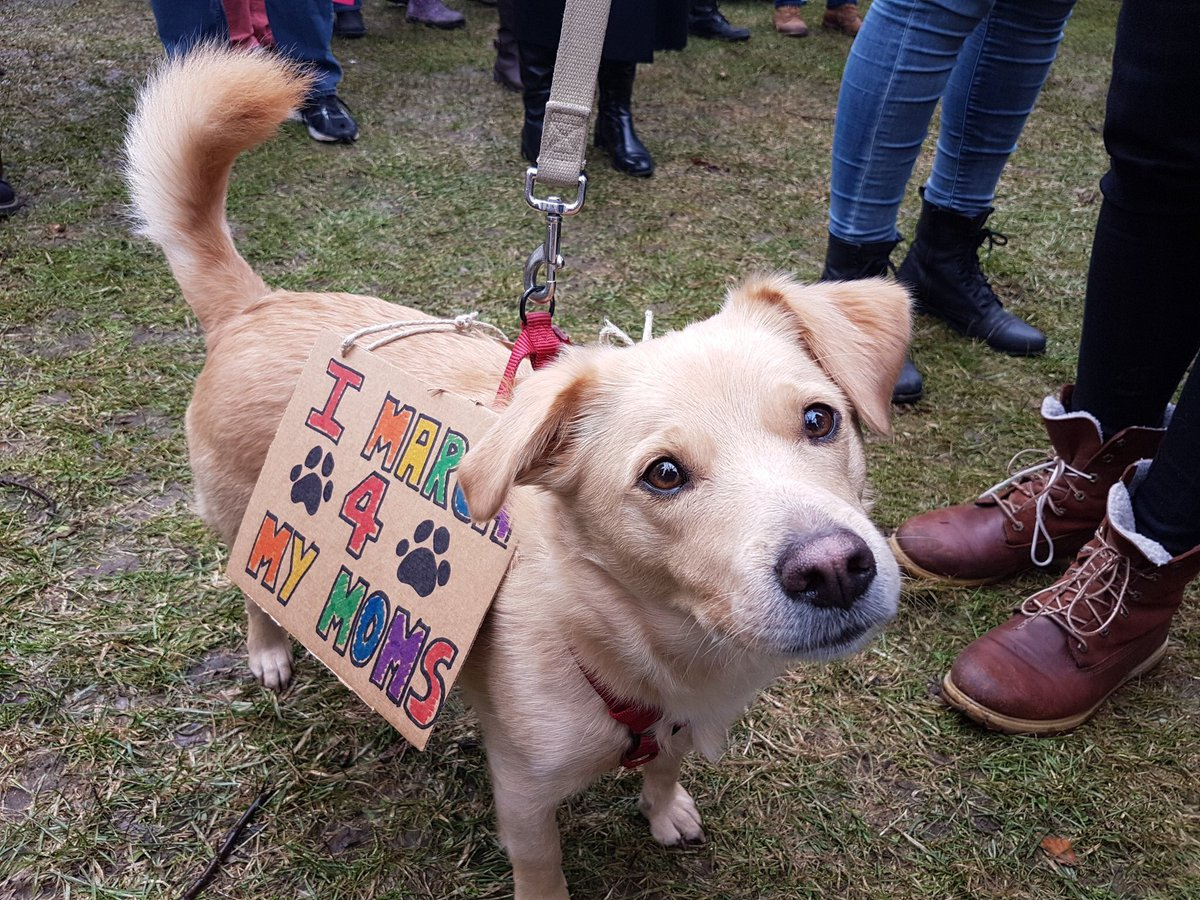
Next, take a look at the top 10 dog ratings and breeds
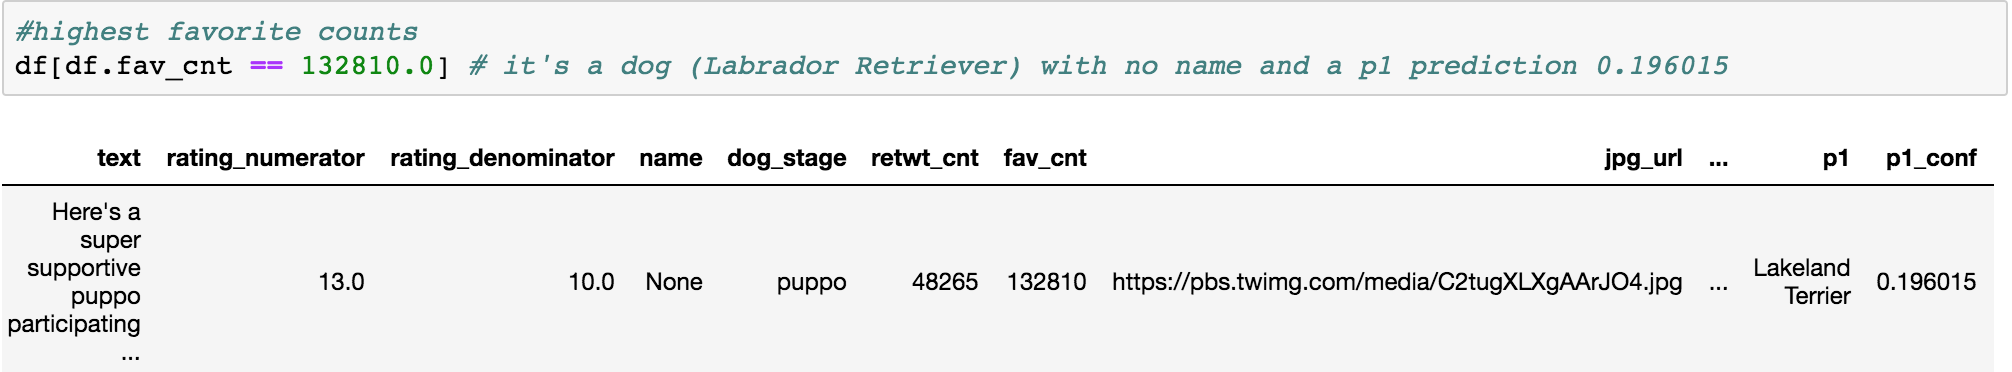
It's a dog (Labrador Retriever) with no name and a p1 prediction 0.196015 and looks like this ...
The highest retweet counts recipient is:

It's a hybrid (Labrador Retriever) with no name and a p1 prediction 0.825333 and looks like this ...

The highest p1 prediction confidence (1.0) recipient is:
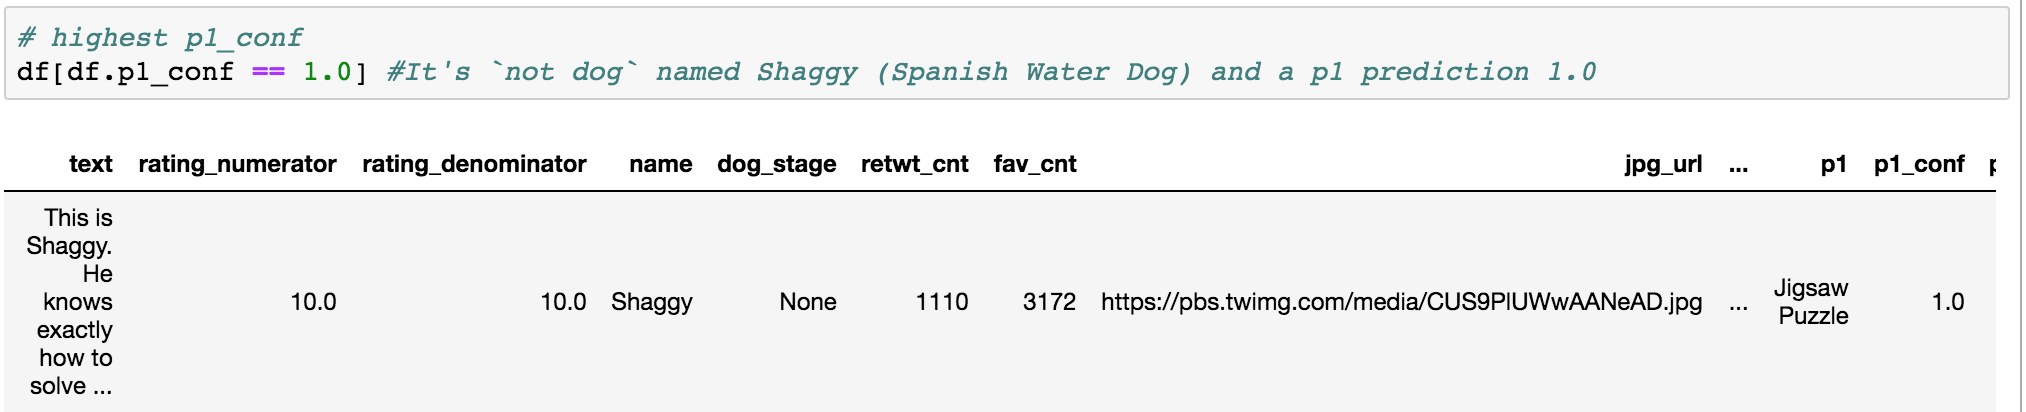
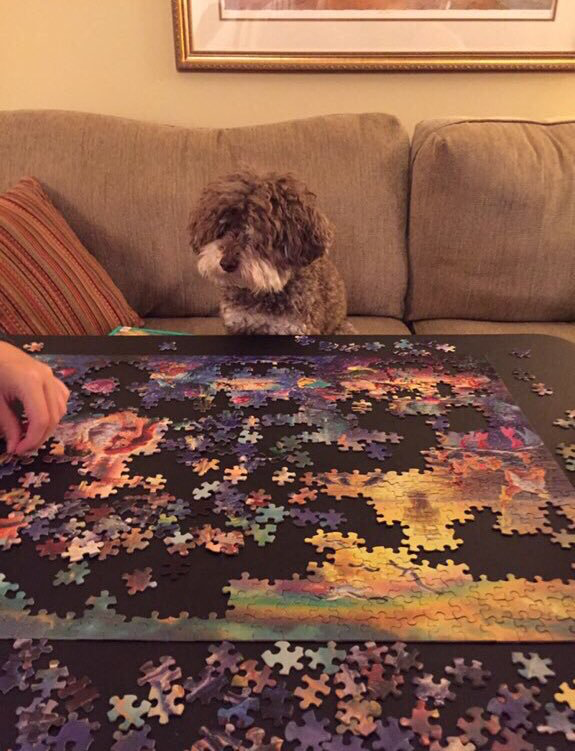
It's not dog named Shaggy (Spanish Water Dog) and a p1 prediction 1.0 and looks like this ...