
An interactive Tableau storyboard on US domestic flight delays and cancellations
Storytelling with a flight on-time performance dataset
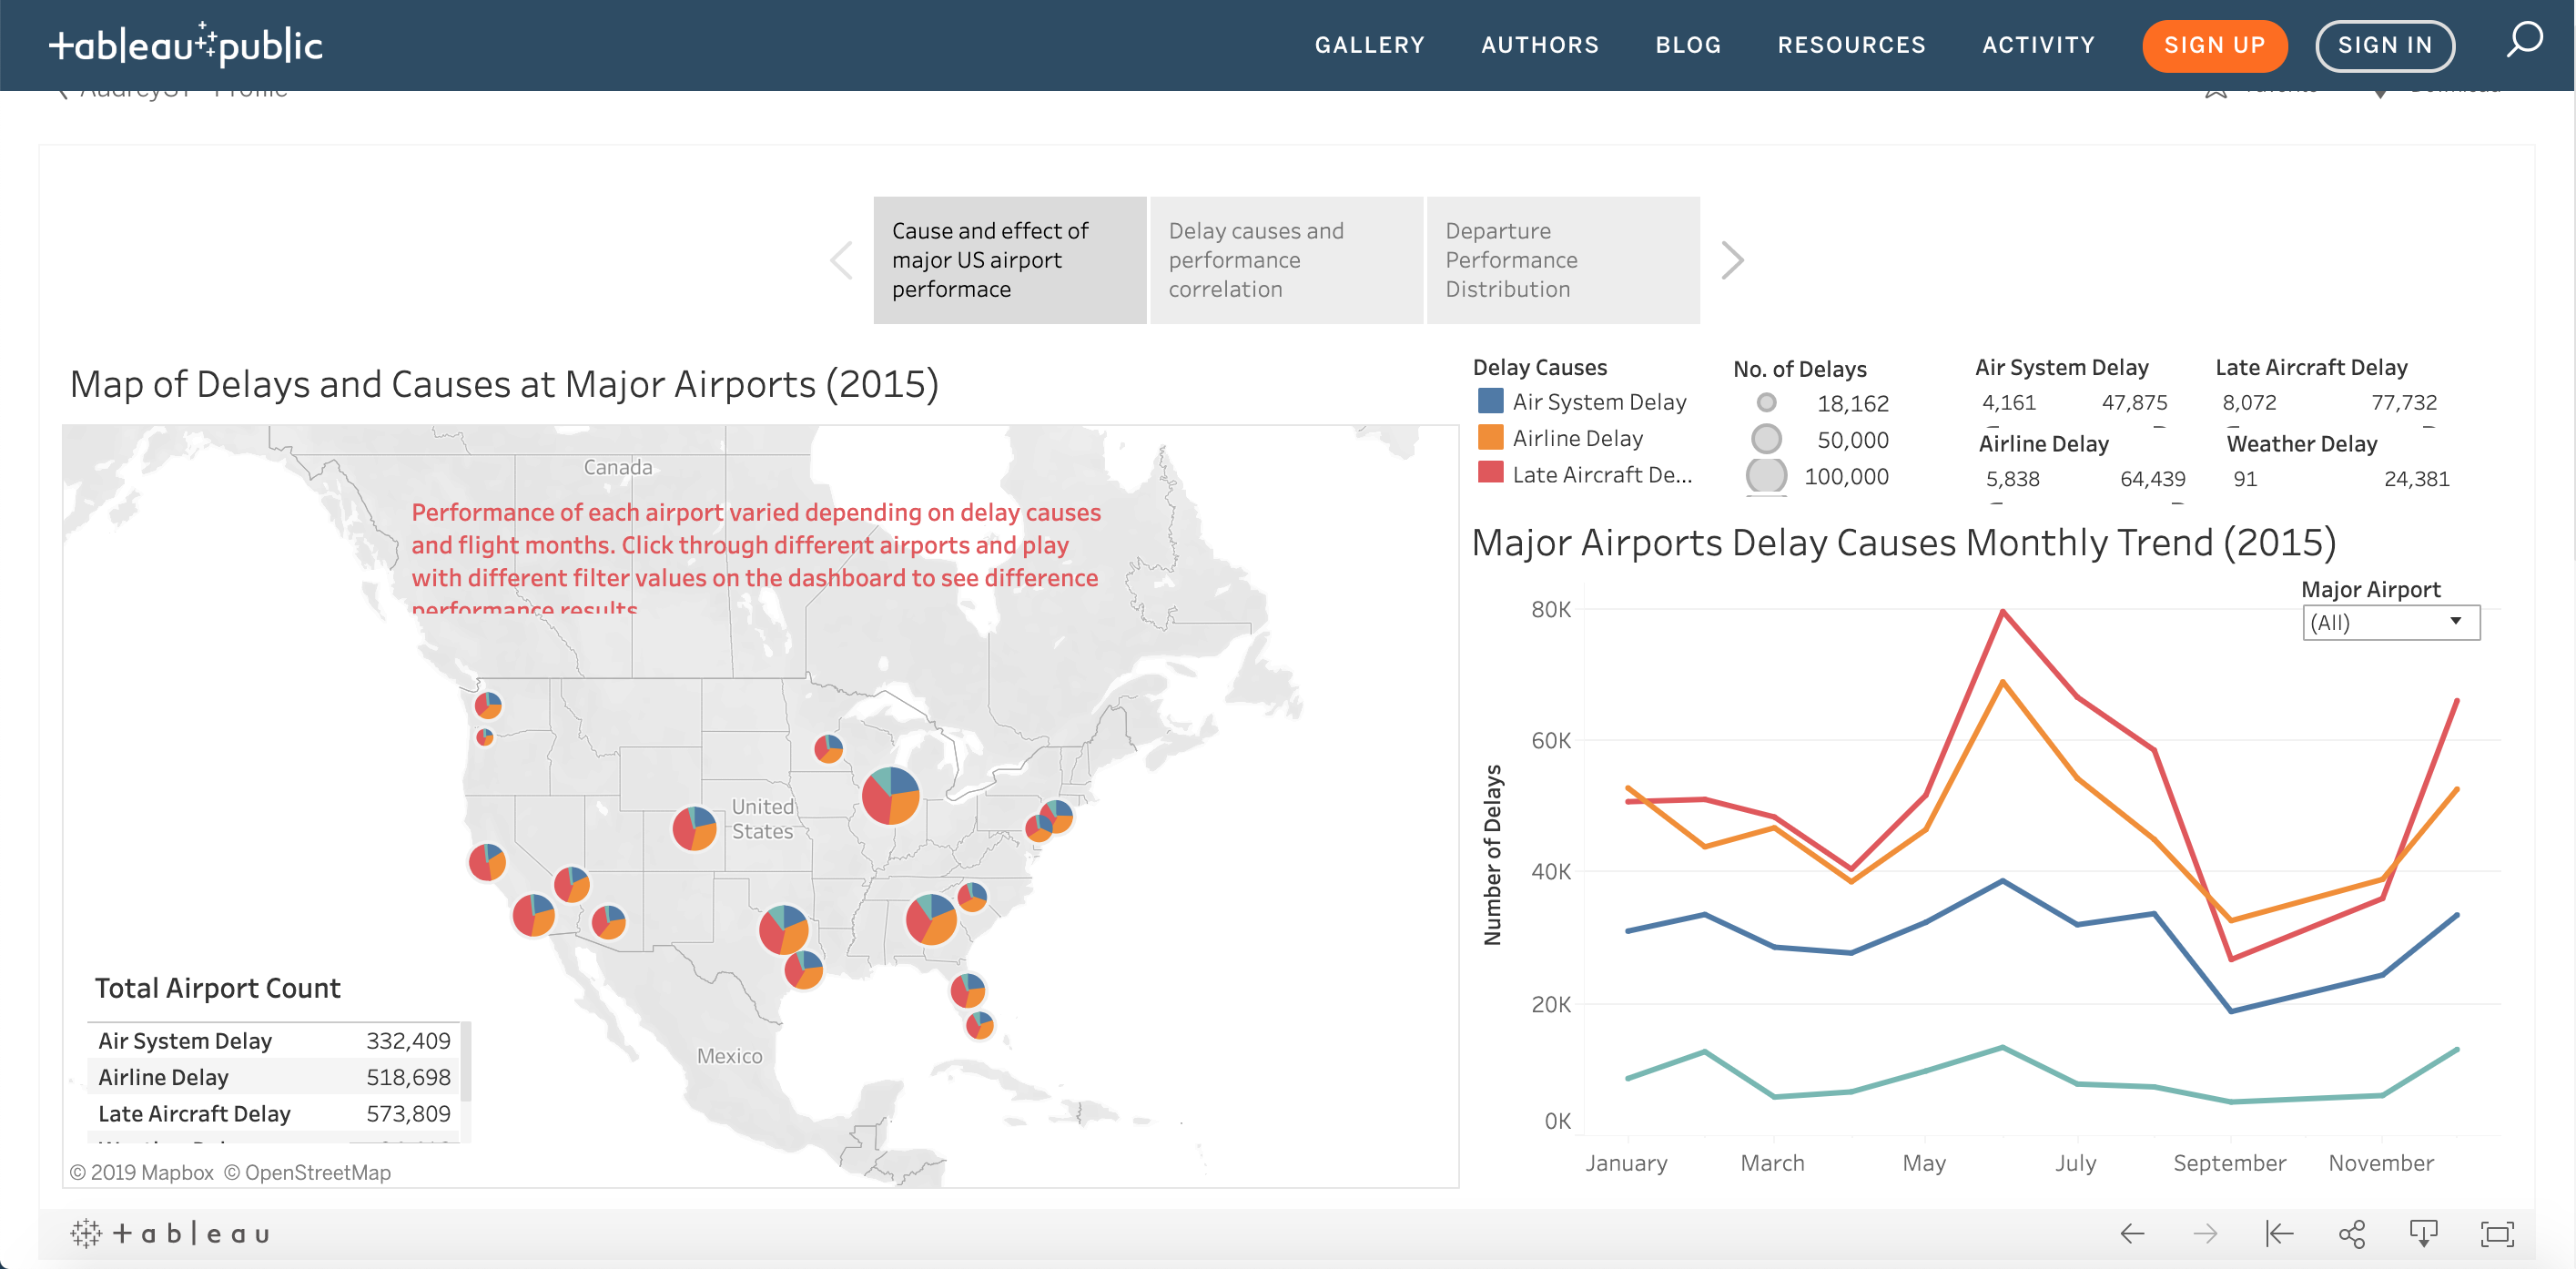
Create an interactive Tabelau story to reveal insights from a 2015 US domestic flight operation dataset. This is part of the deliverables for my Marketing Analytics Nanodegree with Udacity.
DataSet
The data comes from a Kaggle dataset, it tracks the on-time performance of US domestic flights operated by large air carriers in 2015. It is a zip file containing 3 files:
- flights.csv contains 274,964 flight on-time performance records of the major US domestic carriers.
- airlines.csv contains the airline IATA codes of the airlines in question.
- airports.csv contains the airport IATA codes and geographical information of the airports in question.
The dataset can be downloaded here
Process
Analyze the dataset to gain some insights about the on-time performance of the US domestic flights in question, create an interactive Tableau storyboard and a PDF report to reveal the insights gleaned from the dataset.
Tool
Tableau Public, Tableau Desktop
Artifact
- Project 4-Build Data Dashboards.pdf
- project4-Build Data Dashboards.twbx
See code here.